


Waves
End to End Application Case Study
Lake Erie is one of the great lakes and the waves can quickly change. Four-foot waves would toss the occupants of a smaller boat around, anything under 18 feet, and this would be very uncomfortable for many larger boat as well.
The client lives within an hour’s drive to their boat dock on Lake Erie. Occasionally the client heard from others that they were catching some fish and the waves weren’t bad. After arriving an hour later, the waves were higher than expected and the fishing trip was cancelled.
After doing some research, the client found NOAA’s wave data online. This is a collection of information about waves all around the great lakes and beyond. This data is in tabled format that is updated consistently and can be used to predict the wave height, but the focus of the app is to help people who fish to get an accurate idea of the current conditions near the data points. Since the client is only focused on Lake Erie, that will be the initial lake for the app.
CLIENT
Fisherman who lives an hour away from their boat dock
ROLE
Product Design + UI
TIMELINE
8 weeks, 10 hours/week
PLATFORM
iPhone App
DELIVERABLES
User Interviews
Product Flow
Sketches
Low-Fi Wireframes
Mid-Fi Wireframes
Branding and Logo Design
Prototype
Usability Testing
High Fidelity Prototype

Research
Before starting to design the End to End application I needed to do some research. A research ramp-up was created to look at direct and in-direct competitors and also get an idea of potential users. After this I was able to utilize the competitors to help create questions for user research. I found 5 potential users for the Wave app and interviewed them face-to-face and remotely. Afterwords, I created an affinity map with their comments which allowed me to determine other potential uses for the app and content that would be needed in the Waves application.


Define
With the research completed, the next step was defining the problem. To do this, I reviewed the Interview Findings and found the key Interview Insights. In addition, I created a Task flow that focused on the main flow for users to locate wave dates for a specific location. This task flow was incorporated into the overall User Flow of the application to help create and understand the various pathways of the application.
Task Flow: Find Location Data
User Flow
Ideate
In the process of generating ideas, I sketched out different pages, interactions, and icons for the wave app. Sketching allowed me to move fast and test the general layout. This also allowed me to think through the interactions and determine what was working and what needed more thought behind the interaction. Overall the sketches were the start to generating the look and feel of the app.
The Low-Fi wireframes let me put a more polished veneer on the UI of the waves app. The Mid-Fi wireframes continued to build upon the original design and were used to test the task flow and to see how users would search for data.
The UI Toolkit was included in the ideate phase because it started with generating the layout, design, and became a home to all of the components that are used in the application. The toolkit has been consistently updated throughout the design process.
Sketches
Low-Fi Wireframes

Mid-Fi Wireframes

UI Toolkit

Prototype
The Mid-Fi wireframes were used to create the prototype.
This prototype was built to test how users would locate a specific Lake Erie area in the Waves app. Below is a screenshot of the prototype with the noodles and also a gif demonstrating one search pathway.
Test
I used Maze to do user testing since I was able to attach my Figma Mid-Fi Prototype inside of Maze. I had 8 users test the task flow asynchronously. There were some hiccups and learning experience with user testing this way and I now have a better understanding of the importance of intricate directions for users.
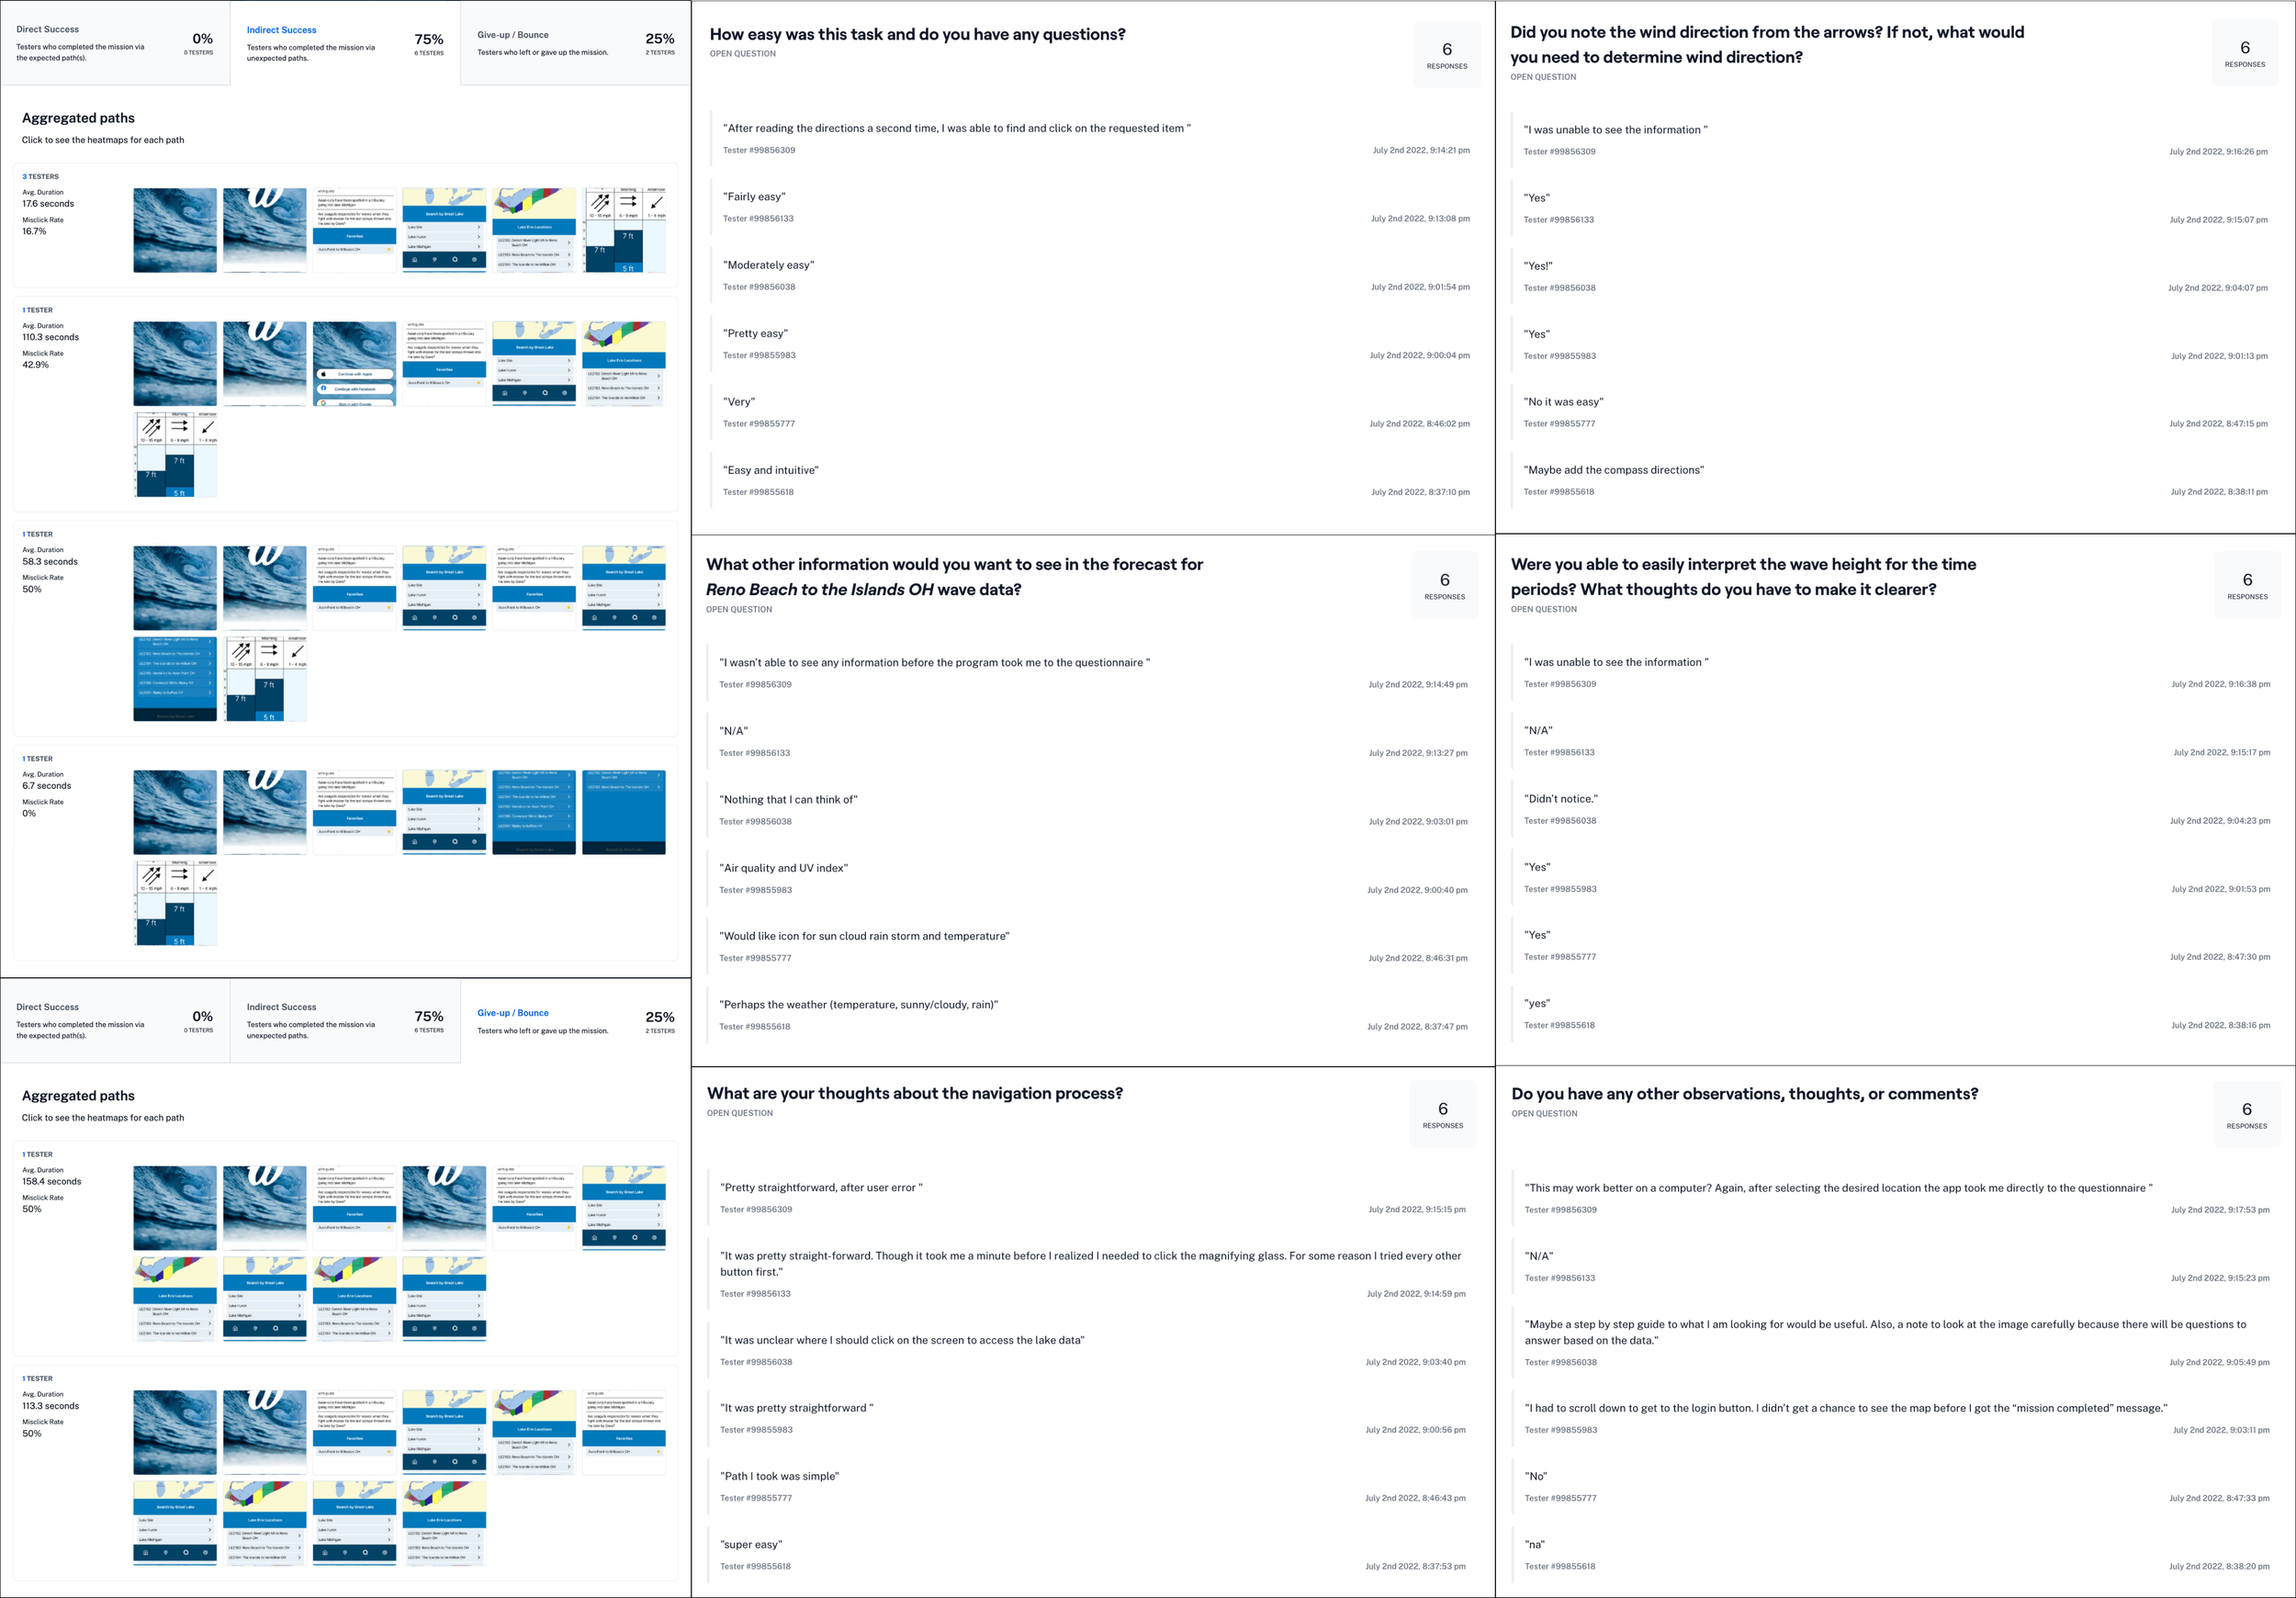
Maze provides a lot of data points to assess how users are locating the wave data for specific locations. The users mainly used the Lake Erie pathway which can be accessed by clicking on Lake Erie in the map or by clicking on the text for Lake Erie. There were two people who bounced because they could not figure out how to access the specific location within Lake Erie.
The main search pathway’s Heatmap is below to help view where users are tapping on the app. Users were not able to play around on the last page to view the wave forecast in the future. This was due to Maze settings.
User Data from Maze Prototype Testing
Main Search Pathway Heatmap

High-Fi Wireframe

Final Thoughts
Working on an End to End application over 80 hours is not enough time to do everything and it is important to focus on the main task flow and work to eliminate unnecessary scope creep.
In this project, being flexible is important because the layout, design, and interaction will not be set in stone from the low-fi wireframes. Things will come up that requires changes.
Starting from a blank canvas can be difficult as there is so many different pathways to investigate but with limited time decisions must be made and they may be based on intuition until time can be set aside to research the best practices.
As always “Perfection is the enemy of progress”.